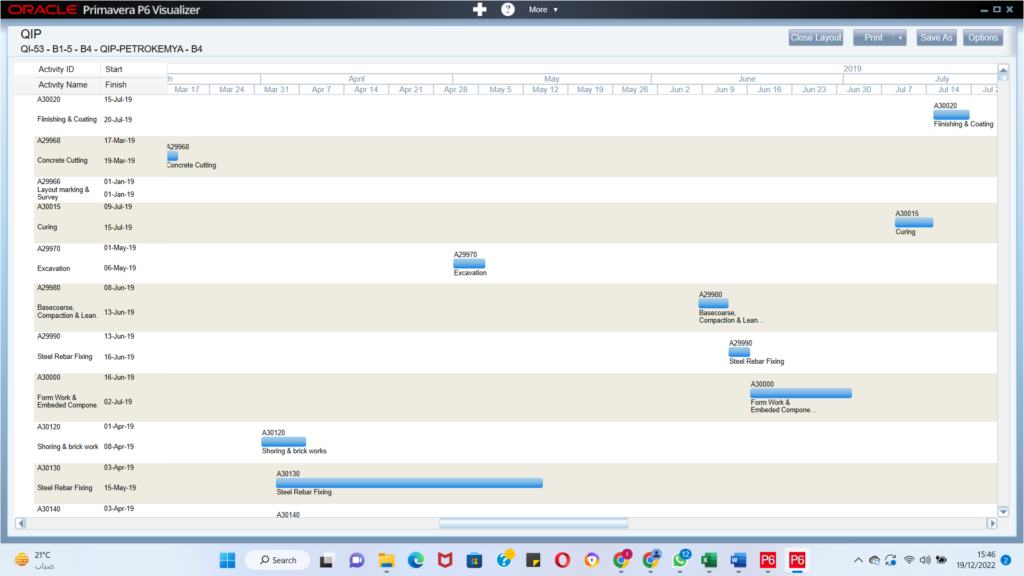
Oracle Primavera P6 Visualizer offers users the capability to create insightful visual data presentations, such as timelines and scheduling information. It enables more effective status reporting for comparison purposes – making it a must-have tool when leveraging Primavera’s P6 Professional or EPPM software solutions.
It is a powerful tool with the ability to create two main types of reports: Gantt charts and Timescaled Logic Diagrams (TSLDs) for efficient project management. Its unique schedule comparison feature makes it even more useful, allowing users to compare their schedules side-by-side for maximum productivity easily. This blog post will explore the features of the Primavera P6 visualizer in detail.
GANTT CHARTS
P6 Visualizer produces Gantt charts that are the pinnacle of clarity and precision. Each task is displayed concisely on its line with a graphical bar representing duration, while dependencies between tasks are linked to give you an instant visual understanding of any project timeline.
You can gain a comprehensive project overview with the Grid view feature. This format, commonly used by experienced Project Managers, provides an organized look into vital information like resource data and key dates. Group or roll-up activities for increased focus on necessary details–the Grid is invaluable when it comes to managing successful projects.
When crafting graphical reports to present to senior stakeholders or clients, you can ensure they have a polished and sophisticated look. You can utilize the Print Preview feature for fine-tuning your report until you are confident that it conveys professionalism in all aspects of its presentation.
TIMESCALED LOGIC DIAGRAMS
TSLDs can offer a clearer, more comprehensive view of your project plan by presenting multiple activities in each row. By condensing the schedule and providing an insight into how tasks drive delivery, they allow you to get right to the heart of your project’s logical connections over time – all at once.
In addition to the advantages of the Primavera P6 Visualizer, the 5 Key Benefits of Oracle Primavera P6 Training can further enhance your project management skills and efficiency.
SCHEDULE COMPARISON
P6 Visualizer’s versatile schedule comparison feature enables you to easily assess any changes made in the current version of your project plan when compared to its baseline version. Its flexible selection criteria, customizable report style, and activity grouping options ensure that understanding and responding to modifications are accurate.
By examining the comparative data from project schedules provided by P6 Visualizer schedule comparison, we can gain valuable insight into how to best keep projects on track and detect any variations in performance levels.
USING PRIMAVERA P6 VISUALIZER
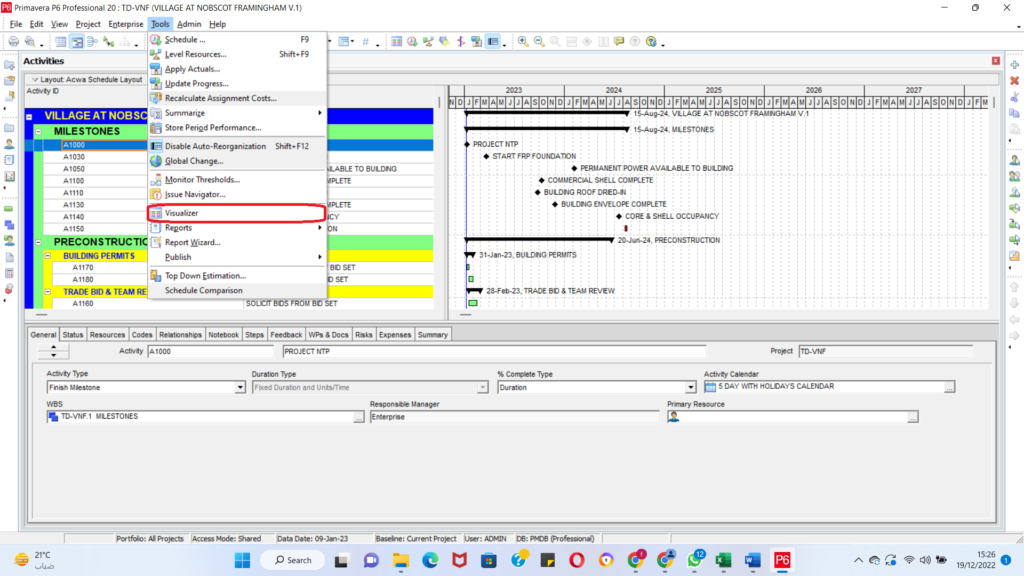
Now that we are familiar with the features of Primavera P6 Visualizer, Put Primavera P6 Visualizer to work in your project management. Its intuitive design makes it easy to launch from within the Tools menu of Primavera P6, as shown below in Figure 1, or open as a separate, standalone application that connects directly with your database.

The Automated reporting feature, coupled with Windows Task Scheduler, makes it easy to save time and effort. You need to define your reports once, then set them to run at regularly scheduled intervals.
With Primavera P6 Visualizer, managing your construction schedule becomes more streamlined, ensuring that projects stay on track and within budget.
Conclusion
Primavera P6 Visualizer is the perfect software for taking complex project data and turning it into an easy-to-comprehend, visually stunning report. Whether you need to present a Gantt chart to experienced stakeholders or those with limited knowledge of such reports, Primavera P6 Visualizer has all the necessary tools available in one place.
Contact Consult Leopard for construction scheduling consultant services now.


