Creating the baseline will help the manager analyze the efficiency of the project’s basic requirements of threat or opportunity. A Gantt Chart Baseline is the current plan of a project. In comparison, the Primavera P6 baseline is the screenshots or images of a project strategy. These images consist of the real dates, period, expenditures, and performance of the project. They help to measure the project plan from all perspectives. Hence, the manager will be able to understand the basis of the running project and analyze its achievement.
In Primavera P6 Proficient, the user can set up and give a project baseline. He may also set up three user baselines for the sum of four. He can present all four baselines on the Gantt chart at the same time. For effective learning about the Primavera P6 efficient project performance, the manager has to show different baselines on the Gantt chart. This guide article will let you know how to Display 4 Baselines on the Gantt chart in Primavera P6.
Steps to Display 4 Baselines on the Gantt Chart in Primavera P6
Generally, there are three essential steps to create the baselines in Primavera P6 Professional. They are given below;
- Take a screenshot of the project at the time of baseline creations
- In the next step, assign the baseline
- In the last step, describe the baseline shortly
Image 1 has a timetable of four required baselines.
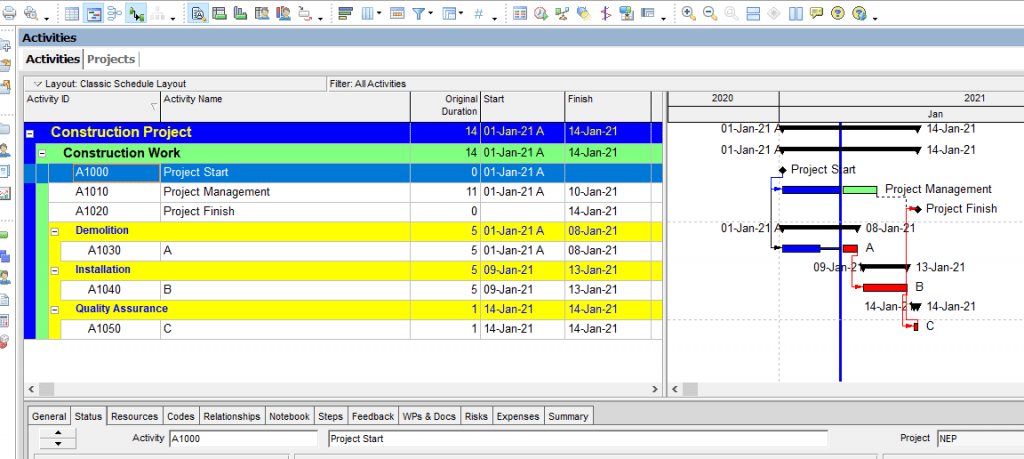
This image shows the baseline for the project starting. It is also displaying the three baselines of three development updates. Now have a look to create all four of these baselines.
- First of all, click on the ‘project’ bar of the Primavera P6.
- Choose the ‘maintain baselines’ function. This option will create the baseline.
Now in image 3, there are four baselines.
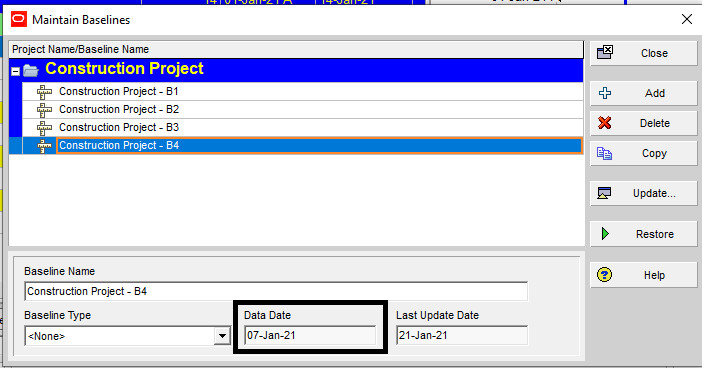
- These four baselines are taken on changed dates and are showing four images.
- You can see the data date January 7, 2021, of Construction Project B4 baseline.
- Now, it’s a step to assign the baseline.
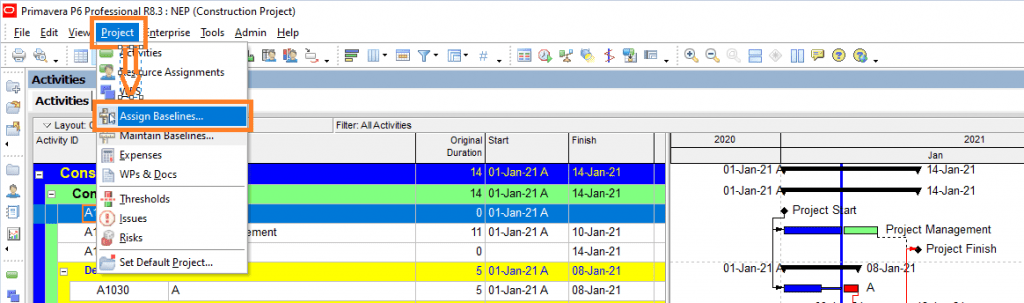
- Now click on the project tab and choose Assign Baselines.
Below image five is showing that the first baseline is assigned at the start of the Project Baseline.
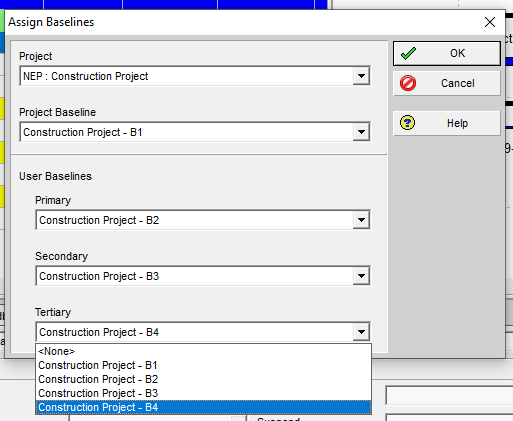
All successful images are step-by-step assigned to Primary, Secondary, and Tertiary User Baselines.
After creating and assigning the baselines, we will now see the display of each baseline on the Gantt chart.
- In the next step, as displayed in image 6, we have to choose the Bar icon in the tool group panel.
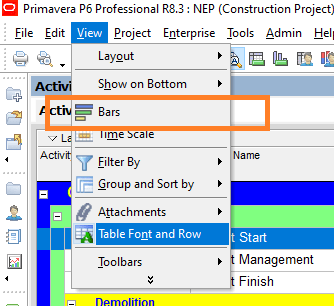
In image 7, all four baseline bar’s short descriptions at the lower side of the stack displayed in the bar menu.
You can see that each bar description consists of different Timescales. On the other hand, they have identical customary filters.
- From the bar-style menu, you can choose the shape, color, structure, and row.
If you apply the proper color and style, it will make the description more instinctive.
If the users select a suitable row and design, it will become more perceptive.
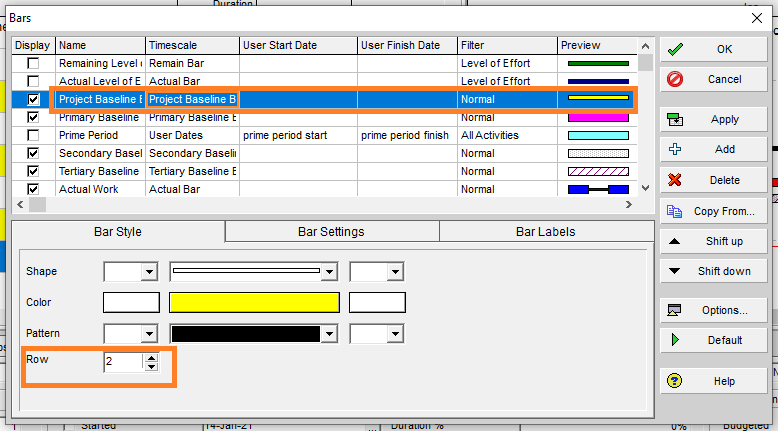
In image 8, the project baseline’s timescale ‘Project Baseline Bar’ has been shown.
In the bar menu, the style and display of Project Baseline’s row have been set. You can also see that it has been set to display on row 2. The style is normal and tall.
In image 9, the primary baseline has scheduled as ‘Primary Baseline.’
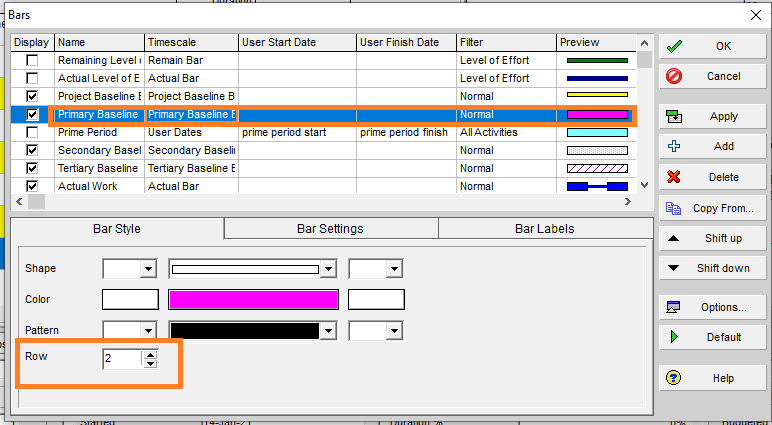
- But now we select a regular l-width style.
- Keeping in mind the importance of exact shape, we choose the low position style.
Image 10 is describing the Secondary Baseline Bar schedule’s ‘Second Baseline’.
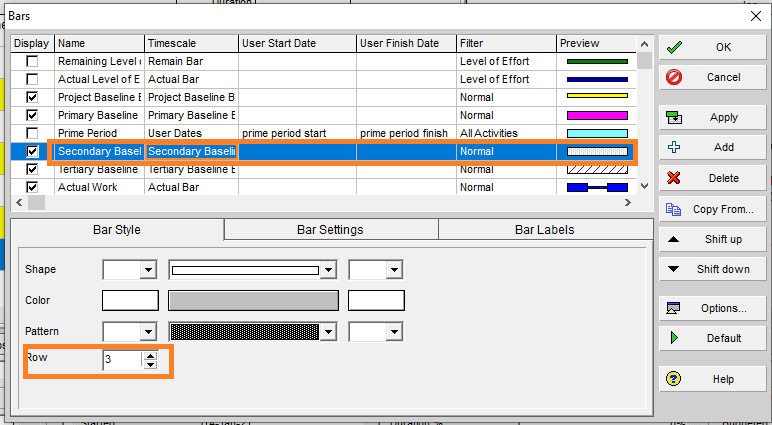
- Now, it will display on row 3.
In image 11, you can see the ‘third Baseline’ having the Tertiary Baseline Bar schedule.
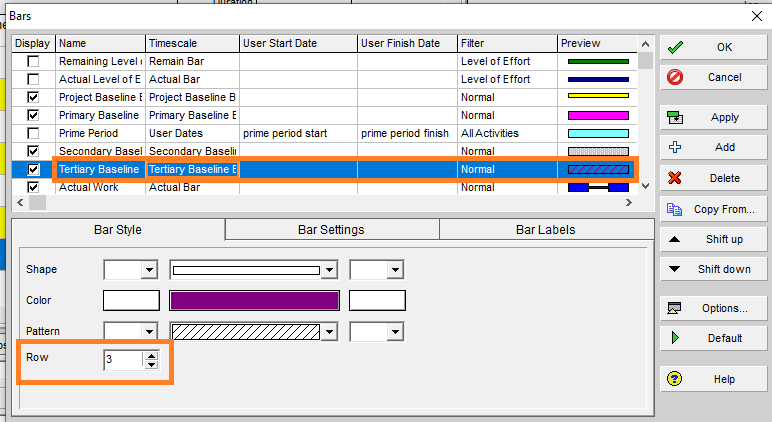
- It is also displayed in row 3.
You can see that all the bar’s description row is normal, heavy, and low. Hence, the row and style of all bar descriptions are clear. Now try to ensure to clasp on to view all baselines.
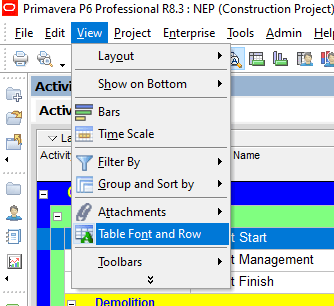
- Hence, it’s time to set the suitable rows of the baseline bar.
- For this purpose, we will click on the view panel and choose the Font and Row bar.
- From the Table, Font, and Row menu, click on ‘keep current row heights’ and set the height for all rows to 32.
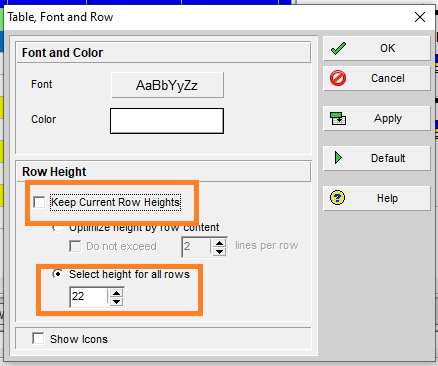
- Now click on the OK option.
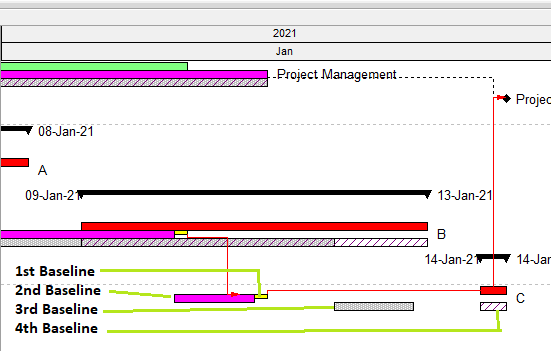
Finally, the Gantt chart and four baseline bars are displayed.
To complement the strategies discussed in this post, make sure to read our guide on Assigning Roles and Resources in Primavera, which will enhance your understanding of resource allocation within projects.
Conclusion
From the above detail, you can see that it is possible to show all four baselines on the Gantt chart in Primavera P6. It consists of the project baseline; when the project starts, its primary, secondary, and tertiary baselines, to analyze the plan developed over time. The main point to show the four baselines depend on the selection of suitable row and bar design. The shape consists of bar placement and style. Primavera P6 Professional never automatically sets the row height. Hence, it is up to you to set the row height according to the display of all four baselines on the Gantt chart.
OUR SERVICES
CONTACT US

SEYAR AZADANI, PMP
PRESIDENT & CEO
Seyar Azadani has over 20 years of CPM scheduling and construction management experience working with general contractors and project owners, including the USACE, DOT, VA, Meta, QTS, Turner, Donohoe Construction, and Whiting-Turner company. As a Construction CPM Scheduling Consultant, Seyar has provided Primavera P6 CPM Scheduling services for government agencies and the private sector, representing owners, general contractors, construction managers, and architects.
Seyar has proven knowledge, expertise, and experience in utilizing Oracle Primavera P6, Primavera P6 Team Member, Primavera Unifier, Bluebeam, MS Project, Procore, eBuilder, Tableau, Navisworks, and Autodesk Revit. As a project controls specialist, Seyar has assisted Meta and QTS with Data Center projects, including new build projects, retrofit projects, and leased spaces.
Seyar has provided project controls services to projects ranging from civil to industrial to high-rise construction, including hospitals and healthcare facilities, roads and highways, high-rise apartment buildings, and commercial projects, utilizing Primavera and MS Project CPM scheduling tools to create and maintain the CPM schedules for his clients. With the US Army Corps of Engineers projects, as a contractor and construction manager, Seyar has built military facilities, including completing the construction of a USACE training facility, a $200+ million project in the capacity of project construction director.
Seyar has a Master of Science degree in Construction Management from New York University (NYU) in Jan of 2012 and a Bachelor of Science degree in Civil Engineering in 2004.