Precedence Diagram Method (PDM):
While handling complex projects with stringent multiple deadlines there is always a possibility that the Project Manager may underestimate or even ignore the criticality of some aspects towards the achievement of a milestone and ultimately the final milestone of project completion. In an attempt to avoid a dire situation like this, the Precedence Diagram Method (PDM) was developed.
Initially, the Project Managers used to draw an empirical schedule as the PDM as shown below:
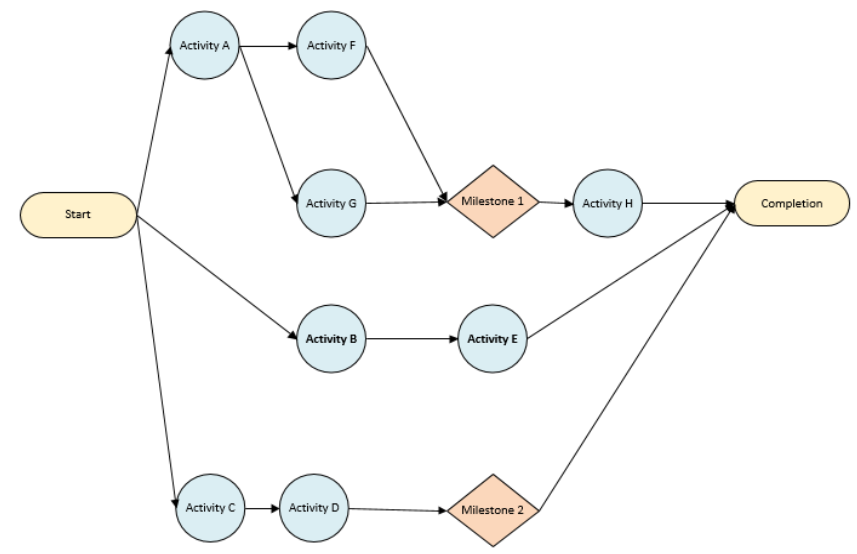
This diagram helped the Project Manager by indicating dependencies and requirements to achieve any milestone or project completion without much concern about their timelines.
Program Evaluation and Review Technique (PERT)
In the late 1950s, PDM evolved into Program Evaluation and Review Technique (PERT) as a similar but more effective technique that focused on schedule and cost simultaneously. In this technique, the duration of activities (or tasks) was also assigned and it was now possible to forecast project completion.
This technique also gave birth to a new term called Critical Path. As the name suggests, a Critical Path is a path composed of critical activities (having the potential of delaying a project) from the start to the completion of the project. Knowledge of critical activities made reducing project duration possible at the expense of additional costs. Cost-benefit analysis has to be done in order to decide whether the project should be expedited by incurring more costs or costs should be saved by compromising on milestones or project completion date.

In this small example, we can easily see critical activities (red boxes) and the Critical Path (indicated by arrows in red).
Gantt Chart
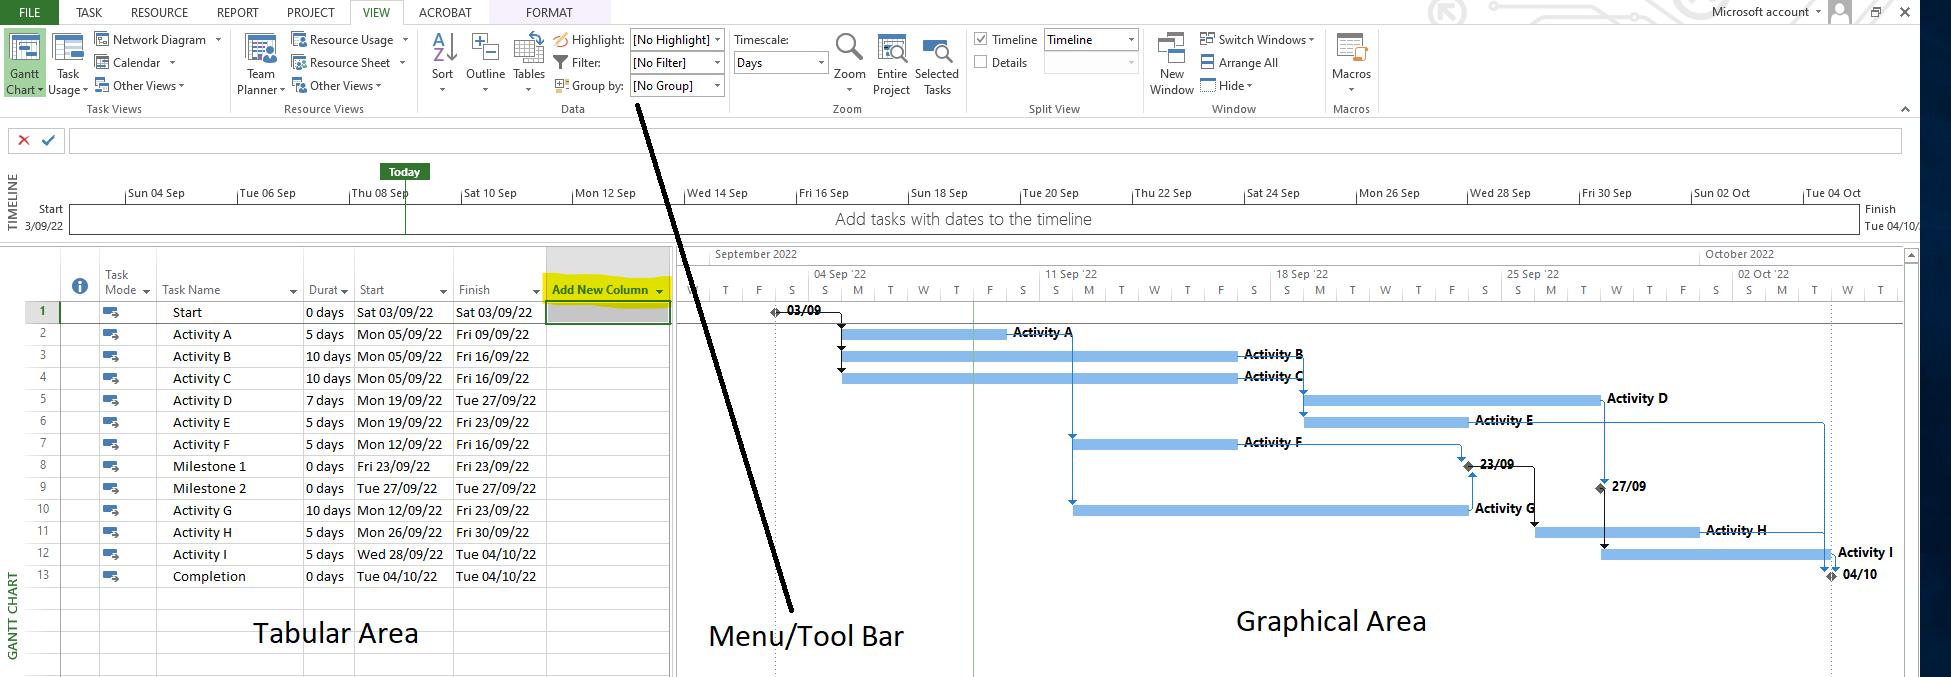
Gantt Chart is an improved representation of a PERT Chart. Although both of them represent more or less the same information, Gantt Chart offers better visualization and flexibility in presenting the information, making it more user-friendly.
In the Tabular Area (on the left side) you can choose from a variety of information to display by clicking on Add New Column. Similarly, you can customize the Graphical Area per your requirements and achieve all of this using the menu/toolbars on the top of the screen.
How to create PERT, CPM, and Gantt Charts in MS Project?
The following steps are to be followed to create PERT, CPM, and Gantt Charts for construction scheduling in MS Project.
Opening a new project in MS project:
When you open MS Project following window will open:
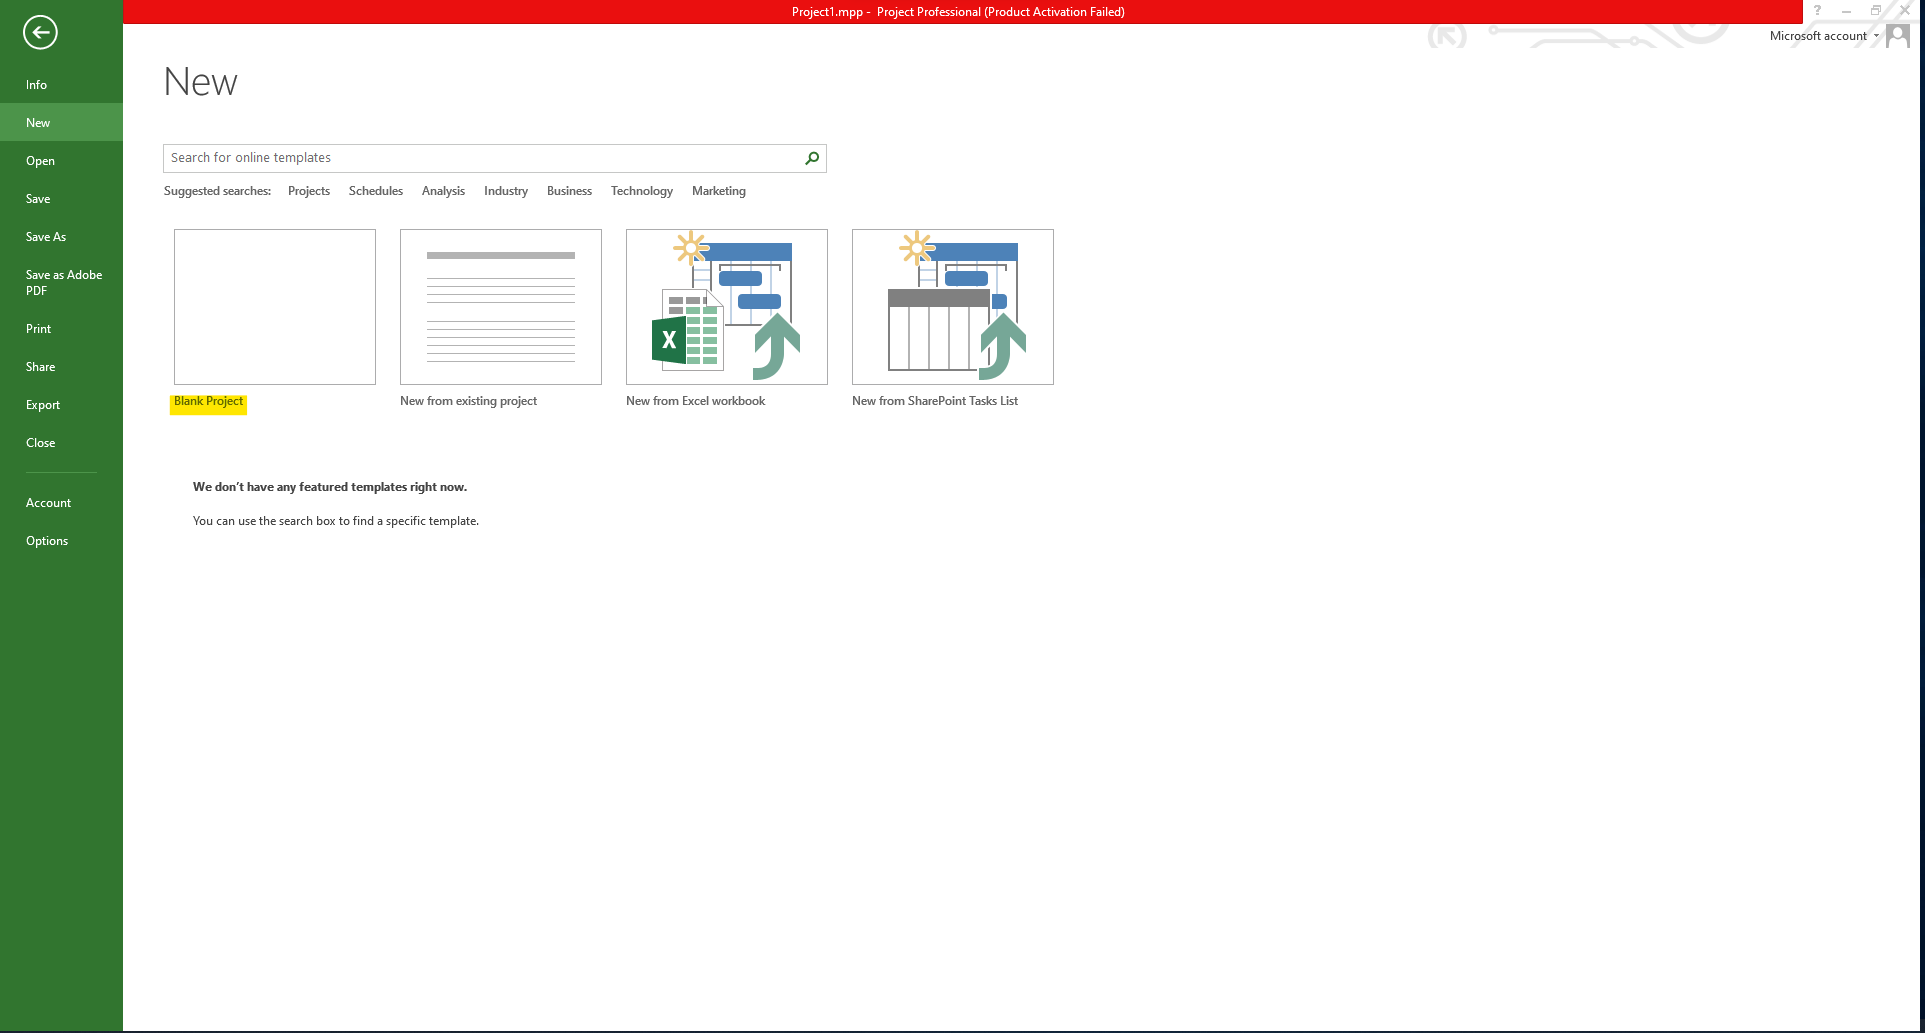
Click on Blank Project following screen will appear:
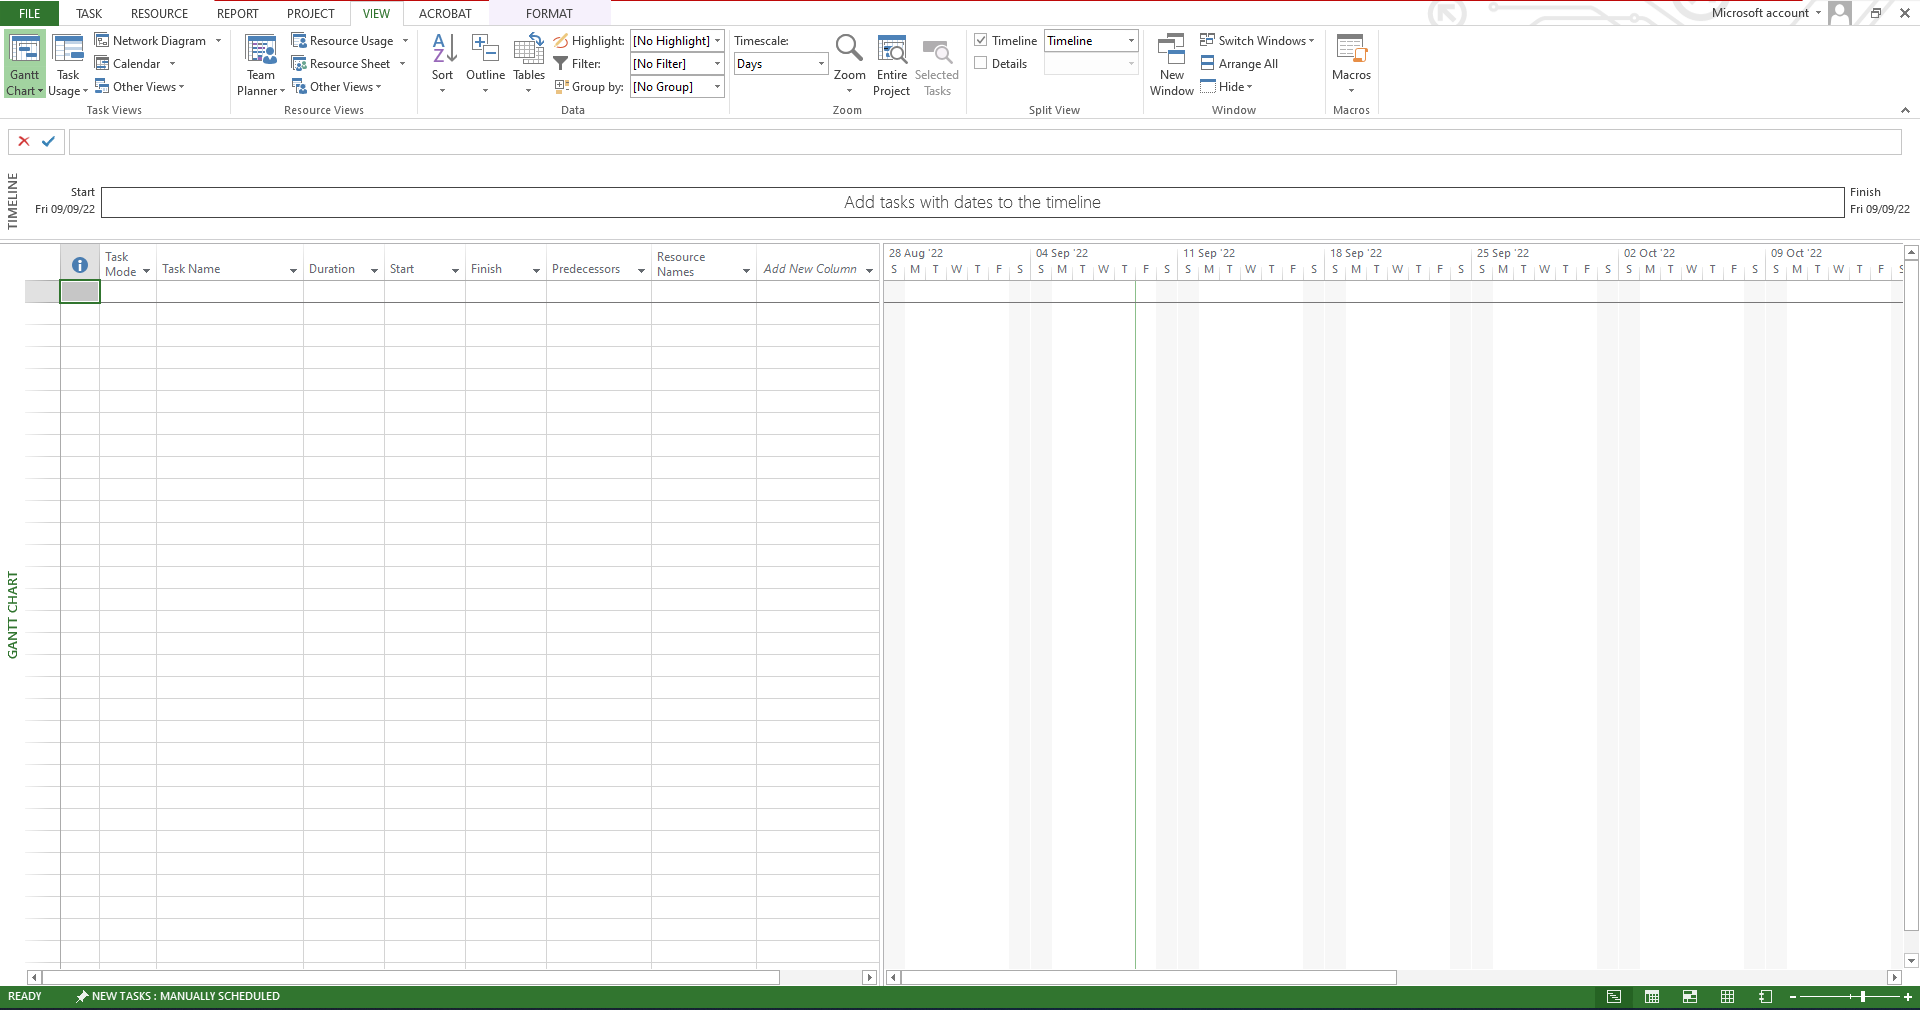
Initial Configuration:
- Before you can start creating Tasks/Activities you need to do certain configurations.
- Click on Files in the Menu bar and the following window will appear:
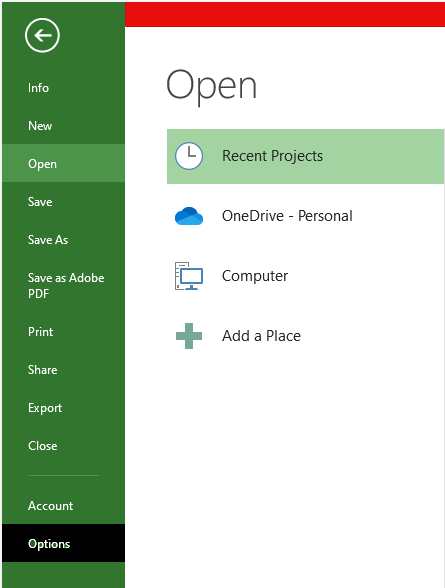
Click on Options and the following window will open:
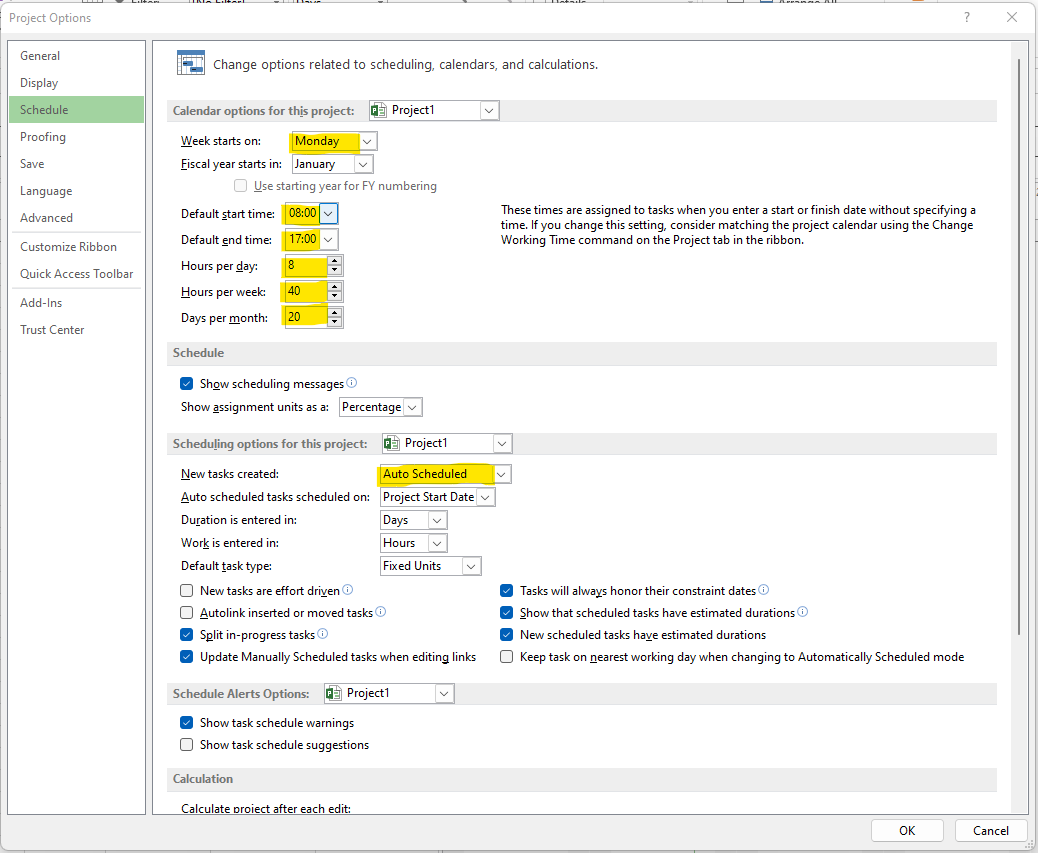
- Depending upon Government Regulations and your organization’s policies, select when your week starts. For example, here we select Monday as the first day of the week.
- Select the Start Time of the day. The default time is 08:00 AM but we can change it as per our requirement.
- Select Hours per Day. The default Hours per week is 40 which means 5 work days per week (8 Hours per Day x 5 Days per week = 40 Hours per Week). And since our week starts on Monday and has 5 work weeks, this means Saturdays and Sundays will be the non-work days. Makes sense!
Adding Work Calendars:
We can define our Calendar and add other holidays by clicking on Project in the Menu bar, then on Change Working Time and the following window will open:
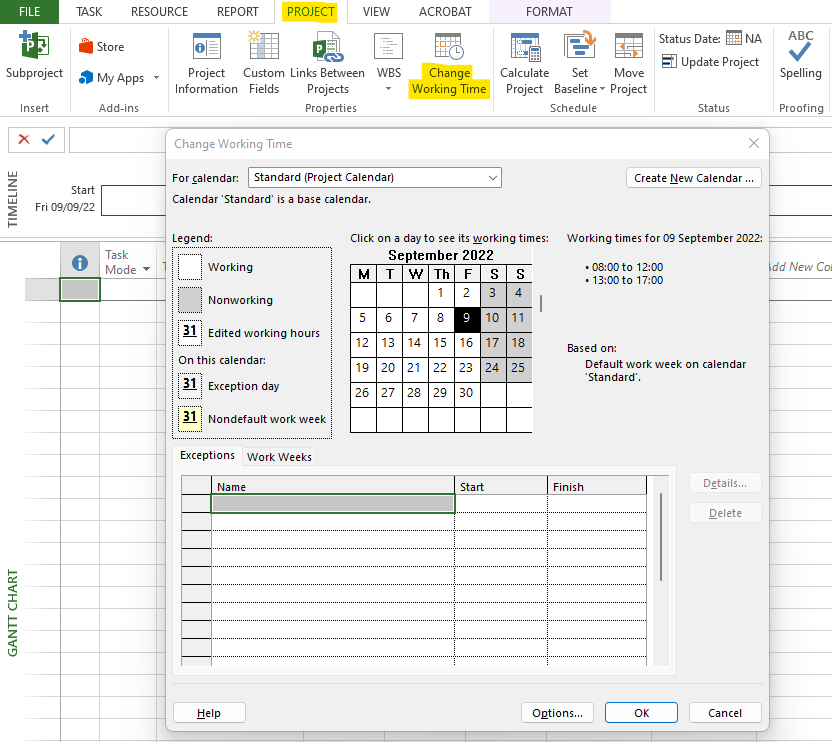
You can add national holidays and other non-work periods over here.
Changing Project Start Date:
In case we need to change project start date or current date, we need to click on Projects in the menubar and then on Information as indicated below:
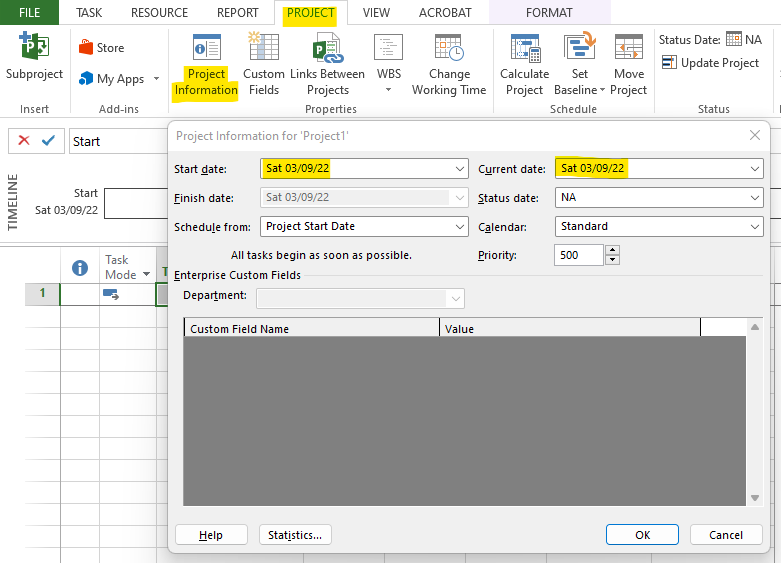
Now that we are done with the basic configuration and can start adding Activities/Tasks.

Adding Activities/Tasks:
- Click on the blank cell under Task Name and type in the name of your first activity as “Start”. Since it is a Start Milestone, enter 0 days as its duration. Since at the time of configuration we had selected the Auto Scheduled option the dates of activity/task will be calculated automatically from the project Start date. Let us add another task/activity by the name “Activity A” with a duration of 5 days.
- Now we need to assign a relationship between these two activities. We can either make an activity a predecessor of the Other, or we can make the other activity the Successor of the first one. Both mean the same!
- To assign Predecessor to select Activity No. 2 and in the Predecessor column type 1. A Finish-to-Start relationship will start appearing by an arrow starting from the end of Activity No.1 to the start of Activity No.2.

If you prefer assigning Successors instead of Predecessors then you will need to add the Successor column in the tabular area as explained below:
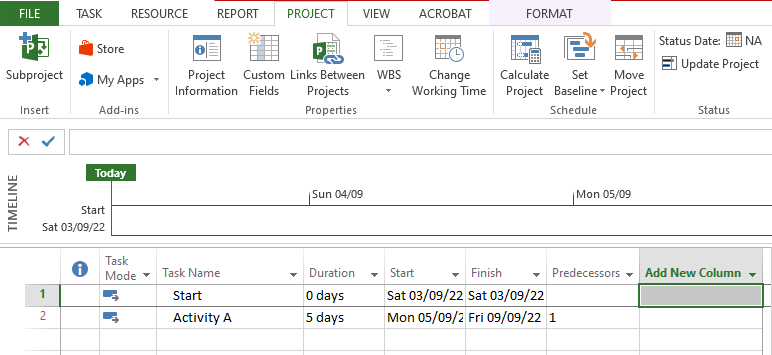
In Tabular Area, click on the small downward arrow in the column named “Add New Column” and a long list of options will appear. Choose Successor from the list.
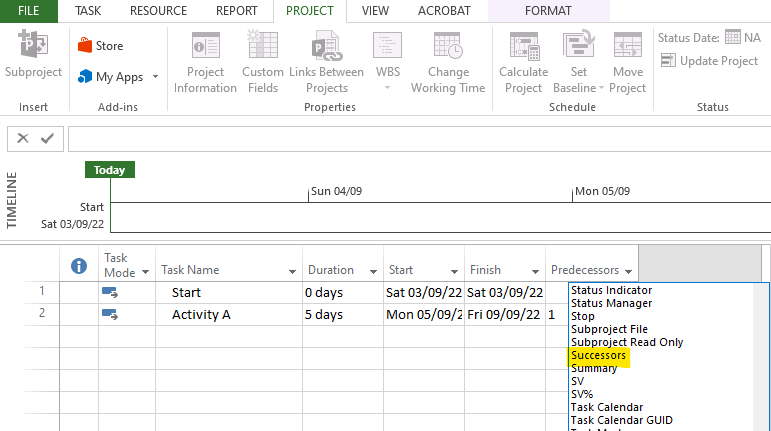
The successor’s column will be added in the Tabular Area. Now you can assign Predecessors and/or Successors of the selected Activity/Task as may be required.
In order to make and change related to the Task or its relationships, double click on that Activity/Task, and the following window will appear:
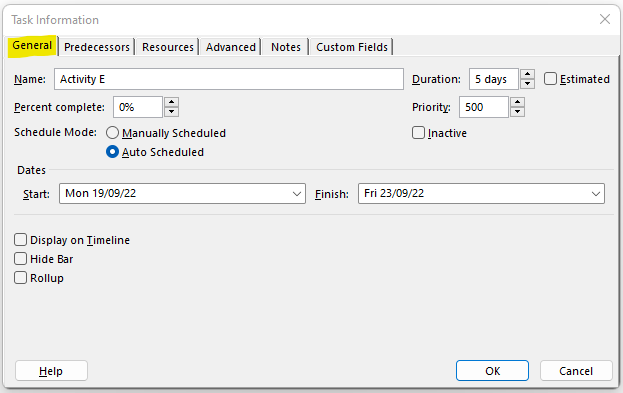
In the General tab, you can change Activity Name, its Duration, and Schedule Mode.
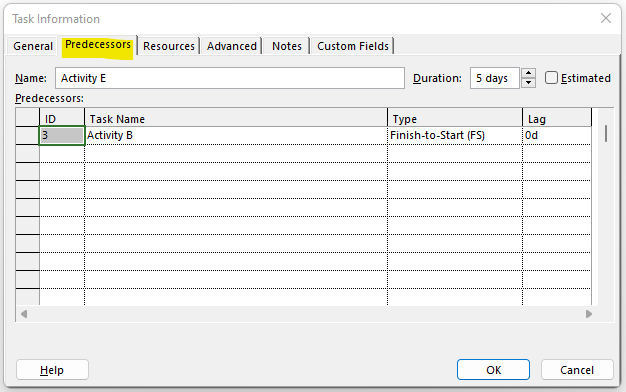
In the Predecessors tab, you can edit relationships and add Lag (if required). Alternatively, you can double-click on a relationship and edit as required. There are four types of Dependencies:
- Finish to Start (FS) – The successor activity can only start after the completion of the Predecessor activity. This is the most commonly used type of relationship/dependency.
- Finish to Finish (FF) – Successive activity can only finish after completion of the Predecessor activity.
- Start to Start (SS) – Successor activity can only start after Predecessor activity has started.
- Start to Finish (SF) – The finish of the Successor activity is dependent on the start of the Predecessor activity. This type of relationship is rarely used.
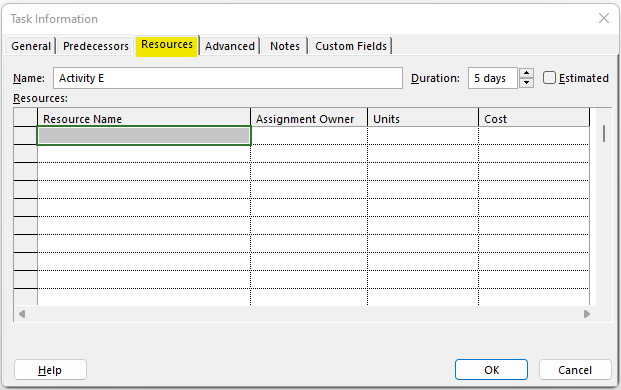
In the Resources tab, you can assign Resources and their Costs.
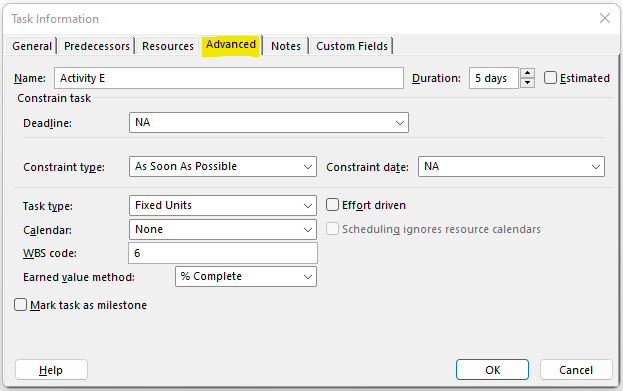
In the Advanced tab, you can assign deadlines (if required), constraints like:
- As Late As Possible
- As Soon As Possible
- Finish No Earlier Than
- Finish No Later Than
- Must Finish On
- Must Start On
- Start No Earlier Than
- Start No Later Than
You can also select Task Type from Fixed Duration, Fixed Units (default task type), and Fixed Work. select or change the Calendar type, Earned Value Calculation from %complete (Duration Based, default) or Physical % Complete (Work Done basis). If required, you can also convert a selected Task into a Milestone.
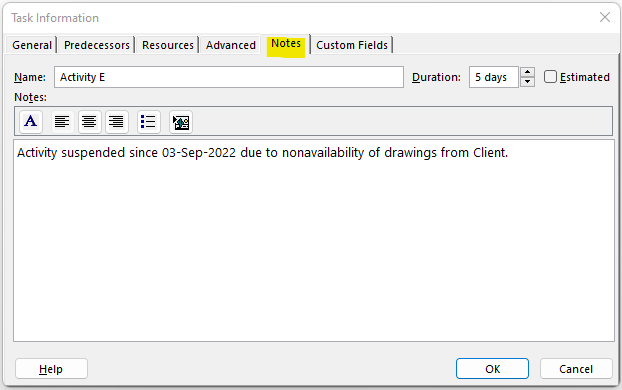
In the Notes tab, you can write any important notes which can help you in any way during the project lifecycle.
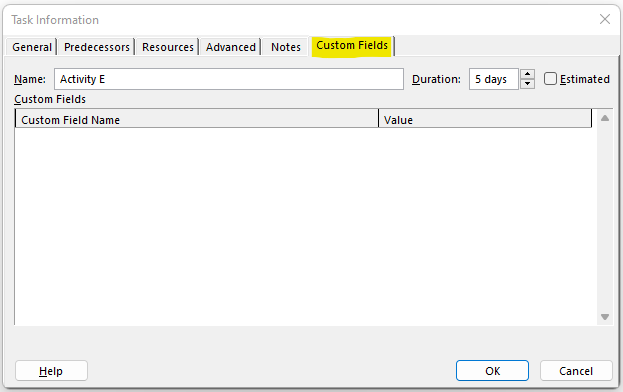
If you have defined some Custom Fields to capture specific data which otherwise can not be entered in MS Project then this tab can be used to enter values for the selected Task/Activity.
You can add all the activities and Relationships that you want by repeating the same step explained above.
After adding all activities and assigning relationships/dependencies, MS Project can calculate various attributes of activities and the project. For example, Early start and Early finish dates, Late start and Late finish dates, Floats, Critical activities, Critical Path, Forecasted finish date of the project, and much more
Now your PERT, CPM, or Gantt Chart is ready and you can look into their various factors in order to manage your project effectively.
Conclusion
PDM, PERT, and Gantt charts play a critical role in the successful completion of the project. MS Project has made it convenient for Project Managers to use these techniques in order to effectively manage the project. Contact Leopard Project Controls for your next CPM Scheduling Project.


