Earned Value Management compares project current actuals against project baseline schedule values. The best way to measure the project’s true performance status is by comparing actuals to date to the approved baseline. A project KPIs can be measured from cost or labor units/hours.
A project’s progress can be well justified if cost is also considered accordingly. If we say the project has achieved 60% of actual progress against 40% of planned progress, this may look very nice. But, if the same project has already spent 80% of the total cost for 60% of progress, then we may not be on the positive side.
Oracle Primavera P6 is well versed in earned value analysis and other project KPIs calculations. Primavera P6 has provided the solution for integration between cost and progress of a project on a single platform. Therefore, it is now easier for planners/schedulers to have a better understanding and calculations of project KPIs such as Cost Performance Index (CPI), Schedule Performance Index (SPI), Estimate At Completion (EAC), and others.
Essentials of Earned Value Metrics:
Earned Value Metrics consist of three main pillars named Planned Value (PV), Earned value (EV), and Actual Cost (AC).
These three pillars will generate all other relevant terms like Cost Performance Index (CPI), Schedule Performance Index (SPI), Cost Variance (CV), Schedule Variance (SV), To Complete Performance Index (TCPI), Estimate At Complete (EAC), Estimate to Complete (ETC), Budget At Complete (BAC) and Variance At Completion VAC).
Earned Value Analysis in Primavera P6:
To get project EVM KPIs in Primavera P6, the following factors should be kept in mind:
- The schedule should be cost-loaded or resource loaded.
- The current live schedule has an established baseline assigned to it.
- Actuals should be stored in Primavera P6 to date. The best practice to update a cost loaded schedule and to bring in actual cost/labor is the followings:
- Before updating a cost loaded schedule, make sure the Actuals This Period has no values and is equal to zero.
- If Actuals This Period is not equal to zero, store the Period Performance so the new actuals are stored for the current period only.
Storing the period performance in P6 allows the users to have better visibility of each reporting period actuals, and thus produces EVM reports per the business financial periods KPIs.
- Activities ‘’Percent Complete Type’’ should be set to ‘’Physical.’’
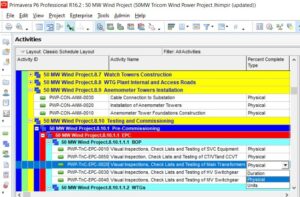
If above-mentioned conditions are satisfied, then it is very easy to show project EV KPIs in Primavera P6.
We can add the following columns from Earned Value available options present in Columns:
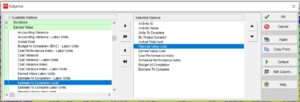
Planned Value, Earned Value, Actual Cost, Cost Performance Index, Schedule Performance Index, Budget at Completion, and Estimate to Complete should be added columns.
After adding these columns, the following data will be shown:
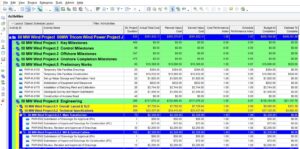
After the schedule is calculated, Primavera P6 automatically calculates the project Earned Value KPIs.
As a simple example, we will explain below the basics of the project Earned Value KPIs calculations:
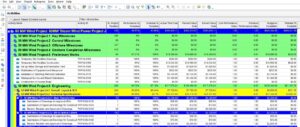
- This project has a Budget value of $800,184. It is shown here as ‘’Budget at Completion’’. The Budget at Completion values are from the assigned baseline to the current schedule.
- As of data date, this project has a planned progress (Schedule % Complete) of 45.66%. So, the Planned Value is $365,376. Planned values are per the assigned schedule baseline planned dates and values.
PV= planned progress x Original Budget (BAC)
PV= 45.66% x $800,184
PV= $365,376
- Similarly, as of data date, this project has actual progress ‘’Physical % Complete’’ of 48.97%. So the Earned Value is $391,832. Physical % complete X BAC is the current EV.
EV= Physical % Complete to Date X Baseline Budgeted Values
EV= 48.97% x $800,184
EV= $391,832
- The Actual Cost of the work performed is also $391,832. Actual cost is the actual cost posted/billed against the project to date.
- Cost performance Index (CPI) is 1. It shows that this project is ‘’On-Budget,’’ meaning for every dollar spent, one dollar is earned.
CPI is calculated as follows:
CPI= Earned Value/Actual Cost
CPI= EV/AC
CPI= $391,832/$391,832
CPI= 1.0
- Schedule Performance Index is 1.07. It shows that the project is ahead of schedule because of 48.97% of actual progress against the planned progress of 45.66%. SPI value determines the progress rate efficiency.
SPI is calculated as follows:
SPI= Earned Value/Planned Value
SPI= EV/PV
SPI= $391,832/$365,376
SPI= 1.07
- Estimate to Complete is $408,352. It shows that $408,352 more is required to complete 100% of the project.
ETC= Budget at Completion- Earned Value
ETC= Budget- EV
ETC= $800,184-$391,832
ETC= $408,352
Displaying EVM graphs in Primavera P6:
Below are simple steps that can be taken to produce S-Curve and show actuals against baseline against earned values.
Click on ‘’Activity Usage Profile’’ and on graphs, then click on ‘’Activity Usage Profile Options’’ to display the following screen:
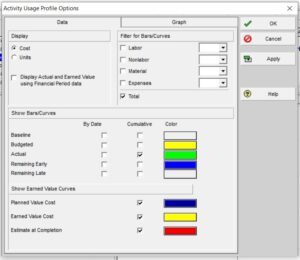
Make all selections as indicated.
Once applied, the following output graph will be generated:
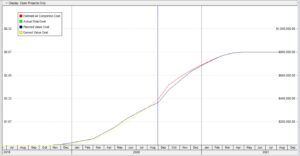
This graph shows Planned Value, Earned Value and Estimate At Completion Cost. If the project has actuals, the actual cost curve may be shown.
Conclusion:
Integration of cost and schedule is best achieved through the Earned Value Management in Primavera P6. This can be done through the use of three EVM metrics, Planned value, Earned Value and Actual Cost, that provide information about how much work should have been completed, how much has been completed along with the cost incurred, and the remaining cost.
A successful project management not only involves understanding Earned Value Management in Primavera P6 but also requires making sound investment decisions. Discover how Net Present Value analysis can assist contractors in our comprehensive article.
Contact Consult Leopard for construction owners rep responsibilities now.


