HOW TO CREATE A GANTT CHART USING MICROSOFT OFFICE EXCEL?
Gantt Chart is a series of lines used for presenting the schedule in a bar chart format. The reviewer may identify the sequence of work, lead, lags, and overlapping activities. You may create a Gantt chart using software such as the scheduling programs Primavera P6, Microsoft Project, and online intelligence sheets. This article will explain how to make the Gantt Chart using Microsoft Office Excel.
Example: As a project manager, send the trade partners a two-week look-ahead schedule, an extract from the master schedule in an editable sheet. Thus, allow them to send back the progress update and their feedback on the plan.
01: Open the Master Schedule
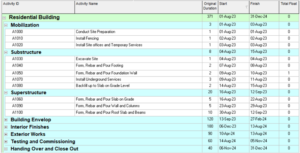
02: Use a filter to identify the list of activities that should be included in the two-week look ahead schedule.
- Select a filter from the View menu.

- Use Filter by to add (+ New) or (Modify) the existing filters.
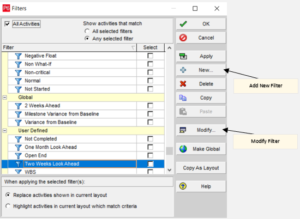
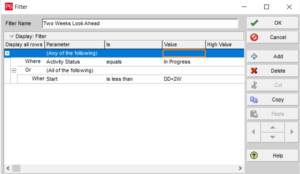
- Modify the filter and insert a conditional formula to reach the target list of activities.
- Apply the filter to present the forecast two weeks ahead of schedule.
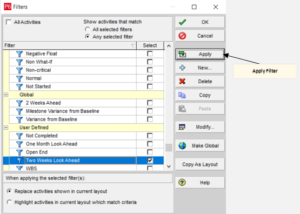
- Review the list of filtered activities and ensure that it matches the target tasks.

03: Export the Schedule date from Primavera P6 to Excel.

04: Create a header and format the table.
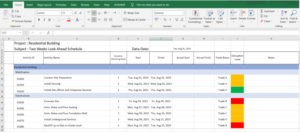
05: Create a timeline.
- Insert the nearest week start date before the data date in Cell L5 and then drag to the right to fill the dates up to two weeks from the data date.

- Insert the Text format “ddd” in Cell L6 and then drag to the right to fill the day text format up to two weeks from the data dates.

- Insert the Text format “mmmm” in Cell L4 and drag to the right to fill the month text format up to two weeks from the date dates.

- Insert the Text format “yyyy” in Cell L3 and drag to the right to fill the year text format up to two weeks from the date dates.

- If applicable, insert public holiday as a letter “H” in Row 7.

06: Format the timeline
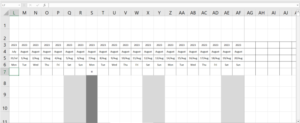
- Select the Conditional Formatting from the Home menu to modify the timeline theme.

- Choose a new rule from the conditional formatting menu, then select a formula to determine which cells to
format.
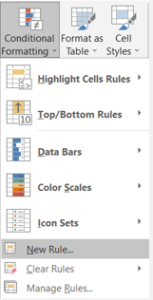
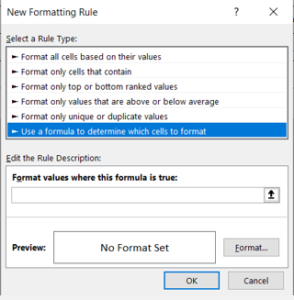
- Edit the Rule Description and format the values if this formula is true for the weekends and public holidays.


- Apply conditional formatting for the timeline cells.
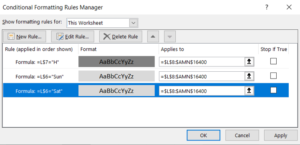
- Review the formatted timeline and ensure it matches with true formula.
07: Create the Bar Chart
- Please ensure that the bar chart formula has been correctly inserted and that the bar chart is displayed within the specified dates, for activity duration. As a result, the formula must be correctly implemented to avoid any misleading in the graphical display. Here we will demonstrate the formula required to format our Bar Chart. Other formulae might be used to get the same result; thus, the formula should be consistent with the logical purpose of the results. Insert the formula below in Cell L10, then drag to the right to fill the bar chart format up to two weeks from the data date and drag down to fill up to the end of the list of activities.
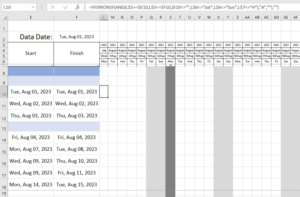
- Check that the letter ‘A’ shows in the bar chart area and matches the dates of the activity duration bounder. However, it should not appear on weekends or public holidays since, as you can see, the formula excludes “Sat”, “San” and “H”, and if the formula condition is true, the letter “A” will appear.
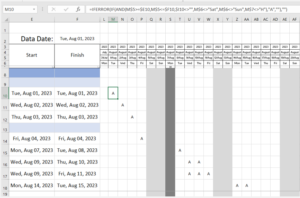
08: Format the Bar Chart
- Select the Conditional Formatting from the Home menu to modify the bar chart theme.

- Select New Rule from the conditional formatting menu, then choose format only cells that contain.
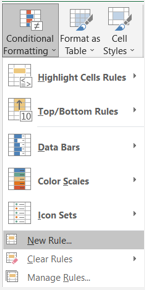
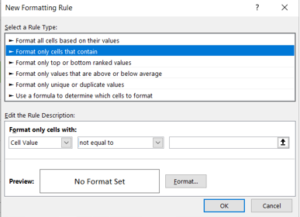
- Edit the Rule Description, which will format the values if the condition of this formula is true. The cells representing the activity’s working days will be colored green. Also, check that green does not appear on weekends and public holidays.
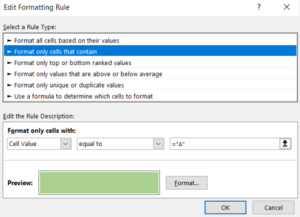
- Apply the conditional formatting for the bar cart cells.
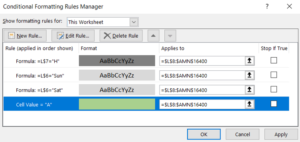
- Review the formatted timeline and ensure it matches with true formula.
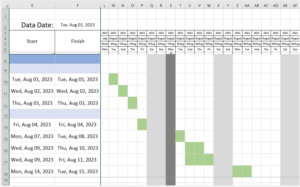
09: Review the Gantt Chart, then share it with the trade partners to let them know the plan for the following couple of weeks and obtain a progress update as well as their input or events that they may want to emphasize, which will be incorporated in the master schedule.

Contact Leopard Project Controls for your next Construction Scheduling
Project!
Conclusion
Using Excel to create a Gantt chart is a practical project planning and management approach. It improves collaboration and decision-making by providing an overview of tasks, timeframes, and interdependencies. However, specialist project management software is worth investigating for projects. Excel Gantt charts are all necessary tools for assuring the practical completion of a project. Because Excel is a user-friendly software, many examples utilizing Excel are helpful, such as making micro schedules, look ahead schedules, and progress tracking.
Understanding scheduler duties and responsibilities is key for effective project management. Leopard Projects Control offers tips


