Relationship lag is the amount of time between the completion of a predecessor activity and the start of a successor activity. For example, if activity A must be completed before activity B can start, and there is a five-day lag between them, activity B cannot start until five days after the completion of activity A. One essential aspect of project management is the scheduling of activities, which involves defining the start and end dates of each task and the dependencies between them. To help project managers to review the relationship lag between the activities, Primavera P6, a popular project management software, provides a powerful feature called the Relationship Lag Report. The procedure to create a new report for Relationship lag shall be as follows:
Creating a new report for Relationship Lag
To create a new report for Relationship Lag we will click “Tools,” select “Reports,” and click “Reports.” Then we will click “Add” to create a new report.

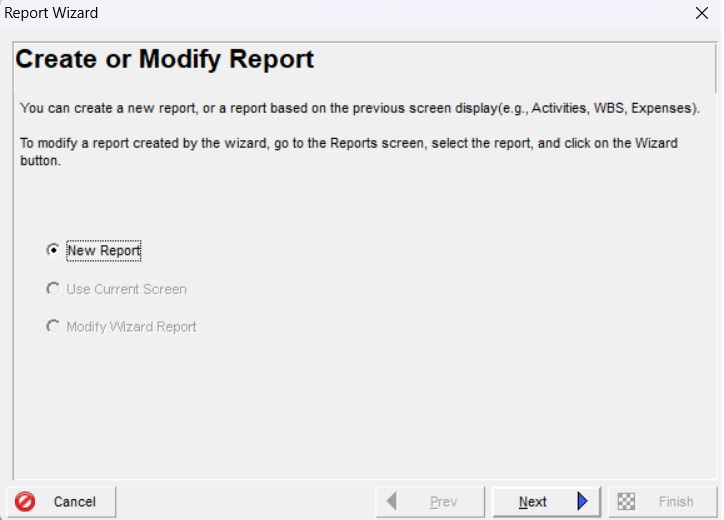
Once we click “Add.” A new window will appear as “Report Wizard,” and we will click “Next.” The next window will appear as “Select Subject Area,” we will select “Activities Relationships,” and click “Next.”

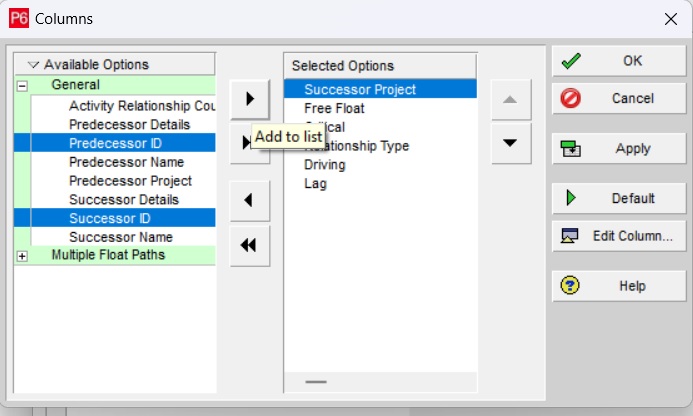
Once we click “Next” in the “Select Subject Area” window, a new window for “Select Additional Subject Area” will appear, and we will click “Next.” Then the Primavera P6 program navigates to a “Configure Selected Subject Areas” window. In the “Configure Selected Subject Areas” window, we will click “Columns.” Then in the “Columns” window we will select “Predecessor ID,” and “Successor ID,” from “Available Options,” click the “Add to List,” arrow to move the selected columns to “Available Options,” and click “OK.”

Now we need to create a filter for the report. To do this in the “ Configure Selected Subject Areas” window we will click “Filter,” and click “Next.” In the “Filter” window we will select the parameter “Lag” greater than “0” to filter the activities with lag more than zero and click “OK.”


The program navigates to the “Configure Selected Subject Areas” window again. We will select the “Group and Sort” option to group and sort the selected data.

Then to group the data, we will select “WBS” in “Group By,” and “All” in “To Level.” The next step is to sort the selected data. To do that we will click “Sort.” The program will navigate to the “Sort” window wherein we will click “Add,” select “Predecessor ID” as “Field Name,” select “Ascending” as “Sort Order,” and click “OK.” Then in the “Group and Sort” window, we will click “OK.”


The Primavera P6 program navigates back to “Configure Selected Subject Areas” again and we will click “Next,” to finish the configuration of selected data.

Then in the “Report Title” window, we will enter the title as “Relationship Lag Report” and click “Next.” The next window is “Report Generated,” and we will click “Run Report.”


In the “Run Report” window, we will select the “Print Preview” option and click “OK,” to see the print preview. The print preview shall be displayed as shown in Figure 15 below.


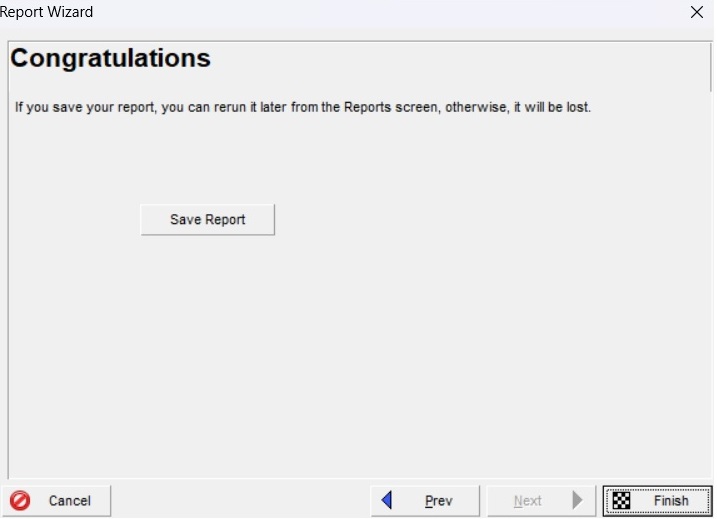
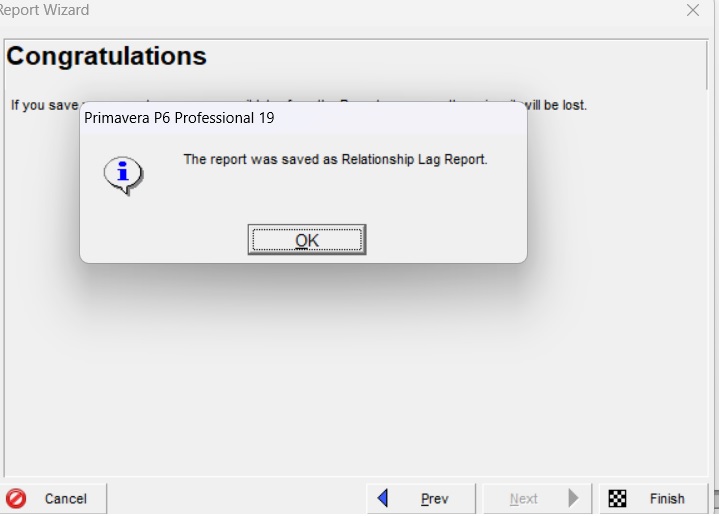
Then we will close the “Print Preview” and return to the “Report Generated window” and click “Next.” The next window is displayed as “Congratulations” and we will click “Save Report,” and Primavera P6 will display a message box as “ The Report was saved as Relationship Lag Report.”
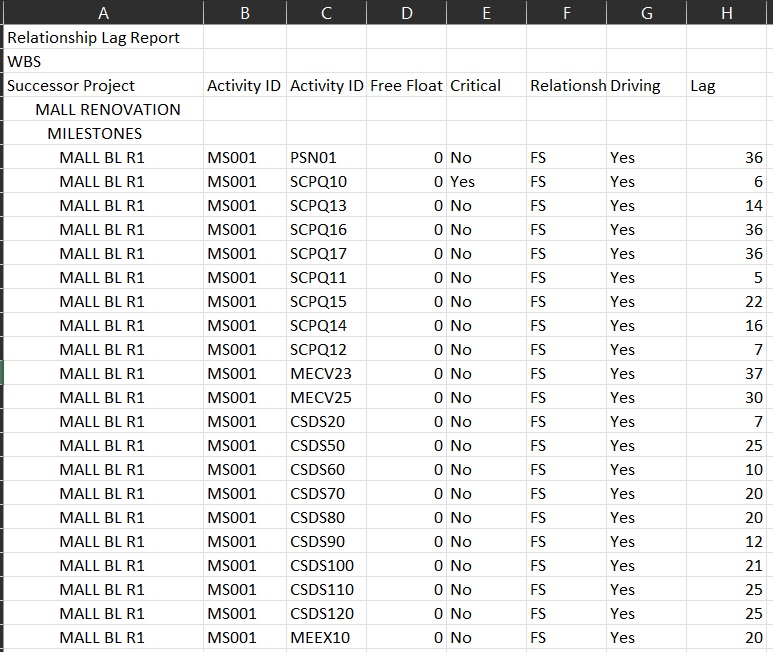
The saved report shall be opened in Microsoft Excel for review and further action by the construction scheduler or project manager.
Conclusion:
The Relationship Lag Report is a useful tool for effective project management, as it provides project managers with a detailed view of the relationship lag between the predecessor and successor activities in the project schedule. Moreover, the relationship lags shall be reasonably modified during the reparation of recovery schedules to mitigate the impact of delays in the project.


