Reports generated from Primavera P6 scheduling software are the most powerful tool to manage a project. Before the start of the project, these primavera p6 reports provide you with a Gantt Chart, expected date of completion, critical activities, near critical activities, Free Floats, Total Floats, Resource requirements versus availability, project budget, and much more. Once the project is started you can monitor actual performance against the approved budget and schedule baseline. Obviously, the quality of reports depends upon the quality of inputs. Ensuring quality of input through Primavera P6 training is a must. A good plan subsequently updated accurately equips you through various reports indicating/highlighting deviations (if any) from the baseline plan and indicating how they affect the target completion date and cost at completion of the project. Timely taken corrective measures based on available information may prevent your project from slippage and/or cost overrun.
Although there are many reports available in Primavera P6 Scheduling Software by default, one may need some specific report to meet any specific requirement. Report Wizard provides useful assistance in designing such reports. Let us see how it works.
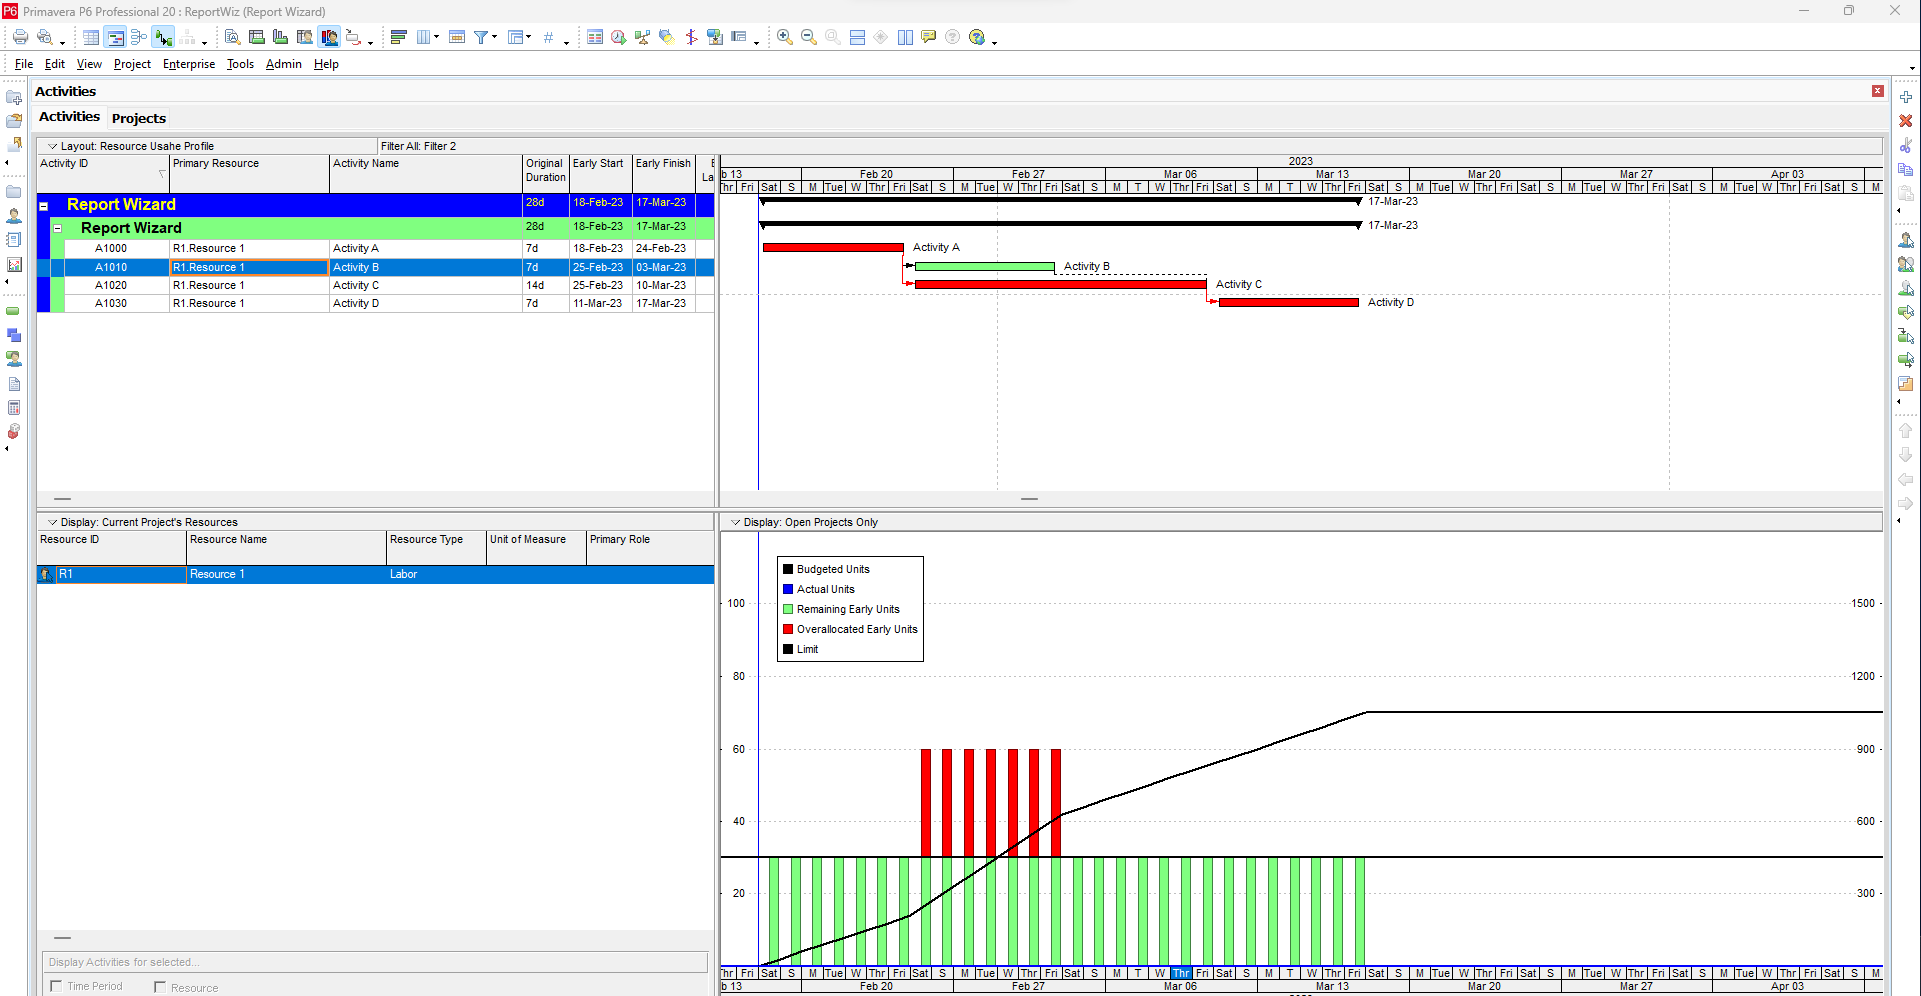
Let us assume we have a plan having just four activities. These activities are linked together and are resource loaded with only one resource (R1 Laborer).
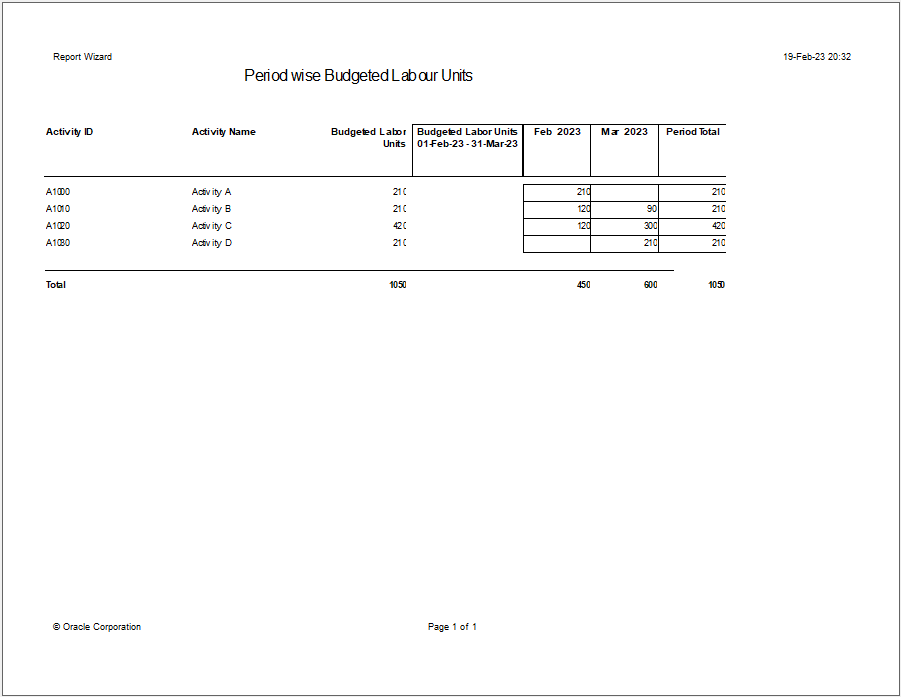
Let us try and design a report that shows the activity-wise monthly distribution of budgeted units of resource R1 (Labor).
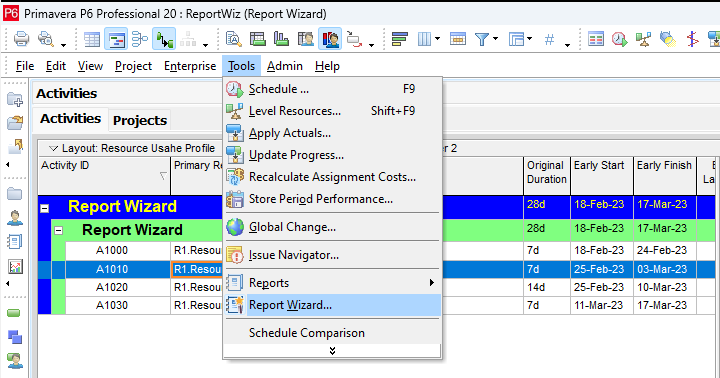
Open Report Wizard as indicated in the following picture.
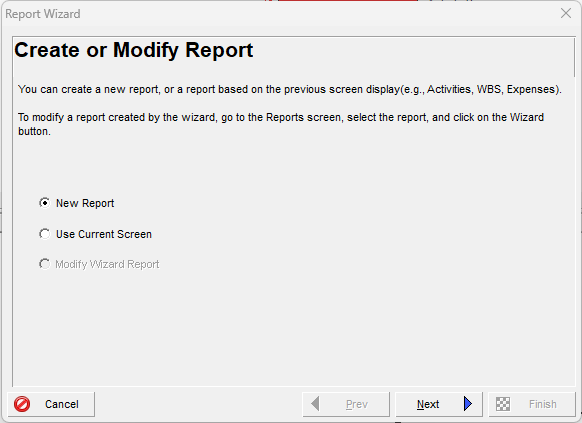
The following window will appear:
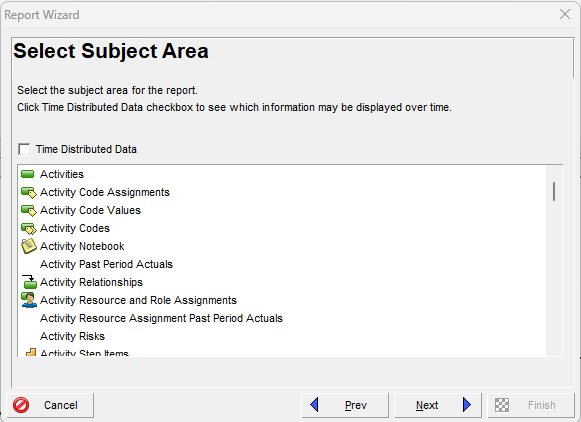
Clicking on NEXT will display the following window:
For a comprehensive understanding of layout and report generation, read our detailed guide on Oracle Primavera.
You can select the relevant Subject Area and check the “Time Distributed Data” checkbox if distribution overtime periods are required.
For our exercise purpose, we will select Activities as Subject Area and check the “Time Distributed Data” checkbox as follows:
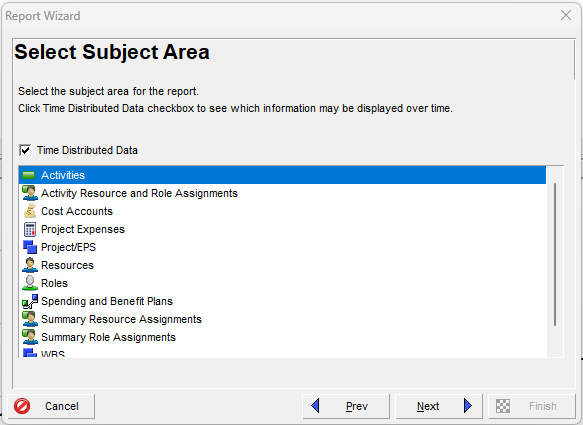
Clicking on the “Next” button will display the following window:
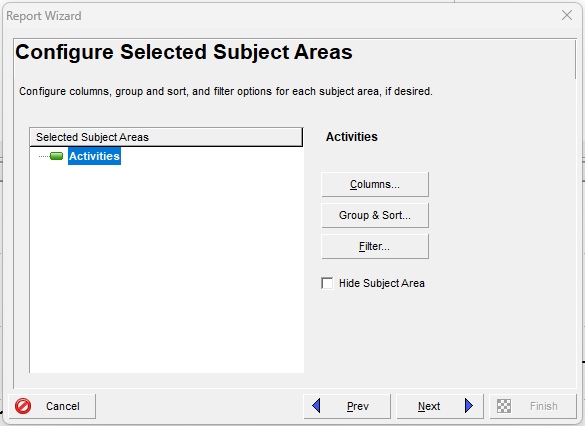
Here you can select the required information from Columns listed below:
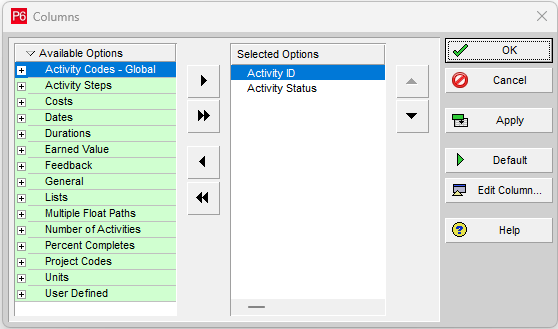
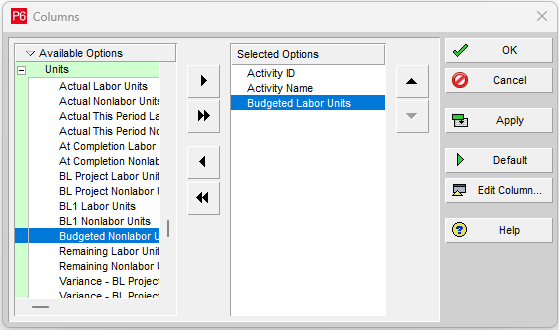
For our exercise we select Activity ID, Activity Name (from the General tab), and Budgeted Labor Units (from the Units tab).
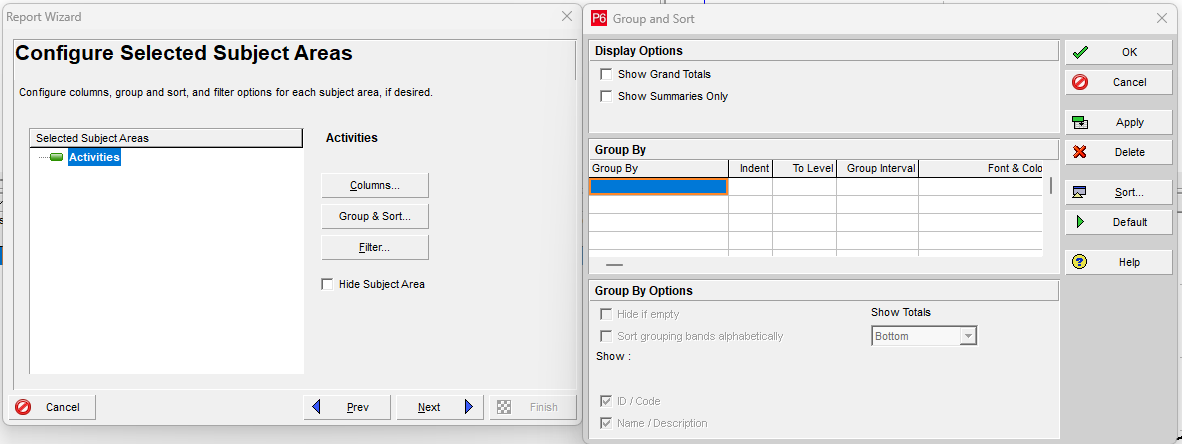
You can click on Group & Sort to organize information to be printed in the report.
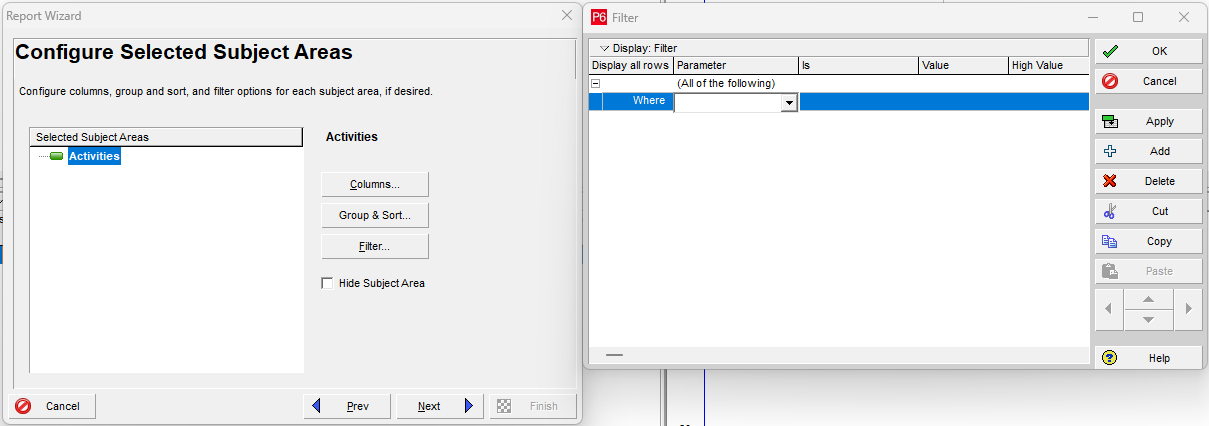
By clicking on the Filter tab you can apply any filter that you need.
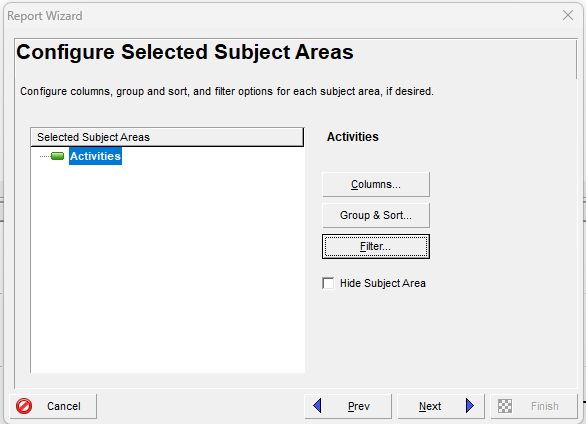
After selecting the required data from the Columns tab, organizing using Group & Sort and Filter tabs, click on the “Next” button.
The following window will appear:
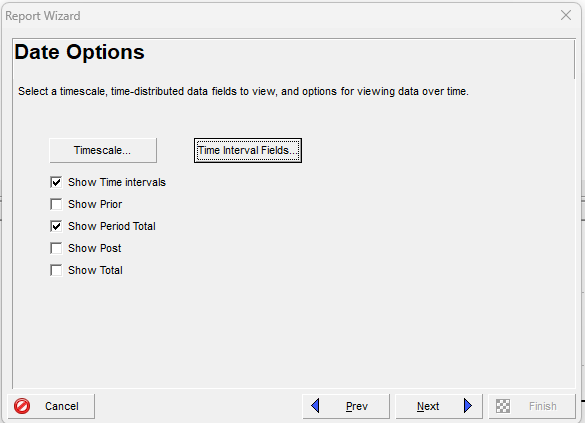
If you click on the Time Scale tab, the following window will appear:
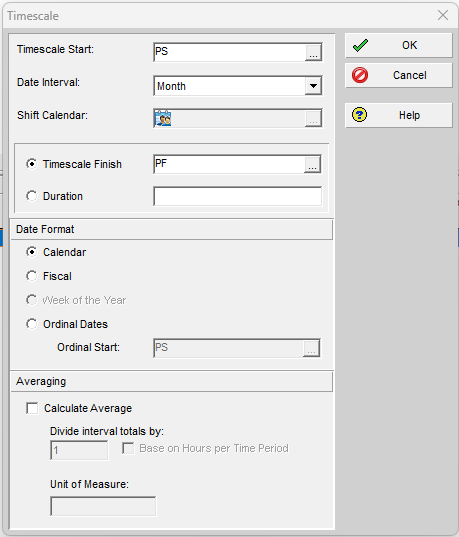
In this window, you can select the Timescale start date, Date Intervals, Timescale finish date, Date Format, and the option to show average values in each period column.
If you select Time Interval Fields following dialogue box will appear:
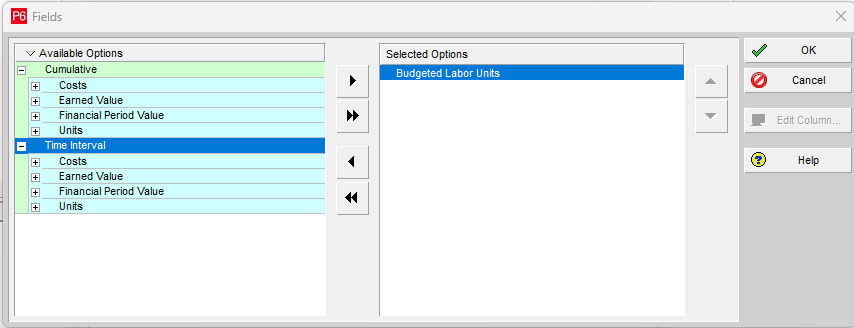
This window gives you the flexibility to present “For the Period” and “Cumulative” values of Costs, Earned Value, Financial Period Value, and Resource Units.
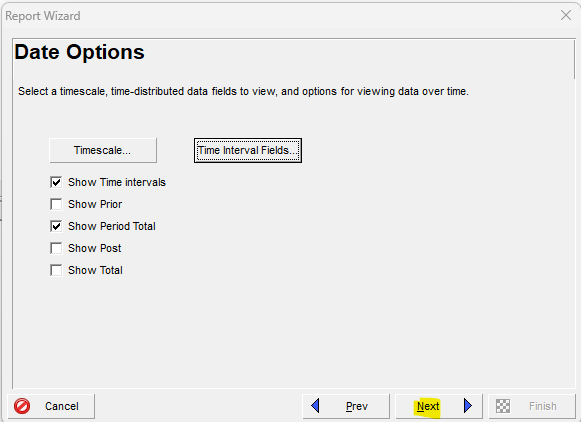
After clicking on the OK button, the following window will appear:
Expand your Primavera P6 skills by exploring our guide on creating reports for relationship lag.
Clicking on next will take you to the following dialog box:
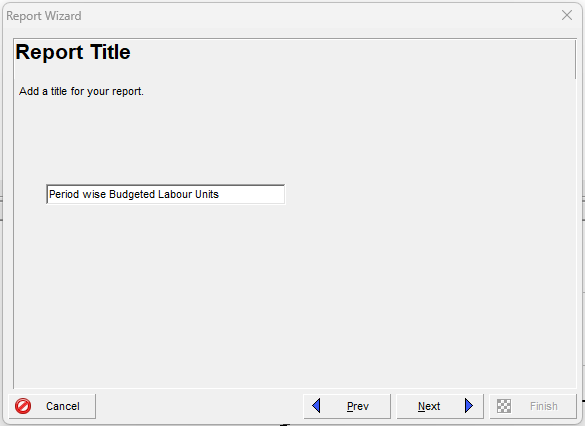
In this window, you can add a suitable title for the report and then click on the “Next” button to reach the following window:
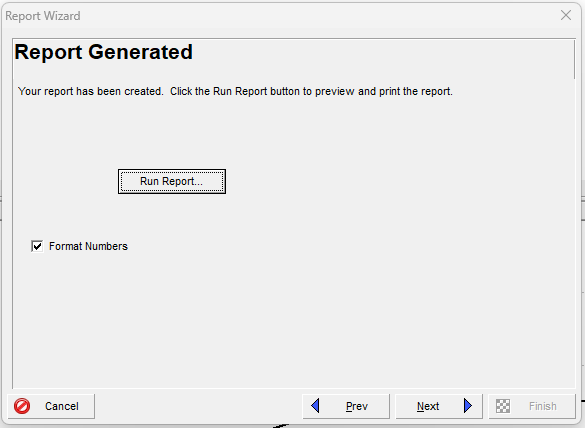
By clicking on the “Run Report” button, the following window will appear:
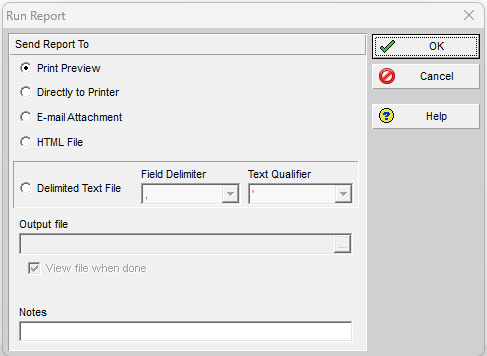
This window enables different options, for example, preview, print, attach with an e-mail or save as HTML or a Text File. If we choose Print Preview, then the following report will appear:
The same process may be followed to generate various reports as required.
Maximize your efficiency in Primavera P6 by mastering Resource Leveling, a crucial technique for managing project resources.
Conclusion:
Although various reports are already available in Primavera P6 scheduling software, one may face a situation where you need some custom-made reports to fulfill your own needs or the Client’s Representative’s demand. Report Wizard is there to help you come out of this situation. With Primavera P6 training followed by ample practice, you can master the art of generating customized reports utilizing a very powerful tool offered by Primavera P6 Reports Wizard.


